Was Codex slow, or was it my Mac?
Activity Monitor shows your Mac’s load now, but not what it was during a run that has already finished. ACTVT records your Mac’s load alongside every agent session, so afterwards you can ask whether a slow run was the agent’s own work or the machine struggling. Its session_machine_context MCP tool lines up CPU, memory, swap and thermal state with the session’s time window and tells you which processes were using the CPU.
2:145 chapters
Step by step
0:00Codex gets a heavy job
I’m in a fresh terminal with ACTVT open behind it, and I ask Codex CLI to rebuild the ACTVT app from scratch and run all its tests. The build has to run outside Codex’s sandbox, so Codex asks me first.
0:26The build takes over the Mac
Once the build starts, I bring ACTVT to the front to watch. While it compiles and tests, the CPU is maxed out, but memory and swap barely move. Back in the terminal, it finishes. It rebuilt everything and all 1,046 tests passed in two and a half minutes.
0:58Was it Codex or the Mac?
That felt slow, so was it Codex, or was the Mac struggling? I close Codex and ask Claude Code.
1:20Claude asks ACTVT
Claude has ACTVT’s MCP tools. It finds my last Codex session first, then asks ACTVT what the Mac was doing during it. ACTVT comes back with the machine’s load over that time and what was using the CPU.
1:44The answer
It was mostly the agent. There was no thermal throttling and no swapping, and memory never went above 77%. Codex’s own build was using the CPU for 70% of the busy time, and nothing else was anywhere near that.
Questions
- Which numbers are recorded?
- CPU, memory, swap and thermal state, plus the busiest processes.
- Can the agent ask too?
- Yes, with session_machine_context.
More tutorials
All tutorials →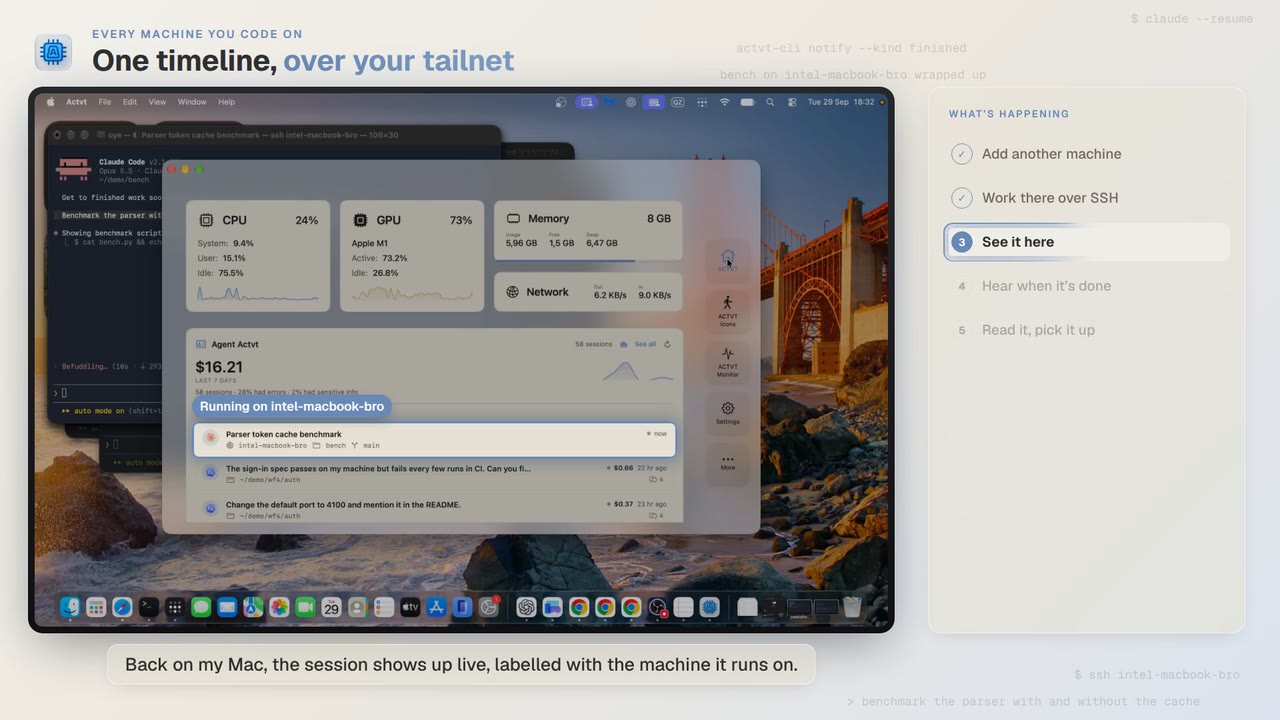 1:24
Every machine you code on
See Claude Code, Codex and pi sessions from all your machines over SSH
Start Claude Code on another Mac over SSH, and you can follow the session from your own Mac while it runs and read the whole transcript when it’s done.
 3:42
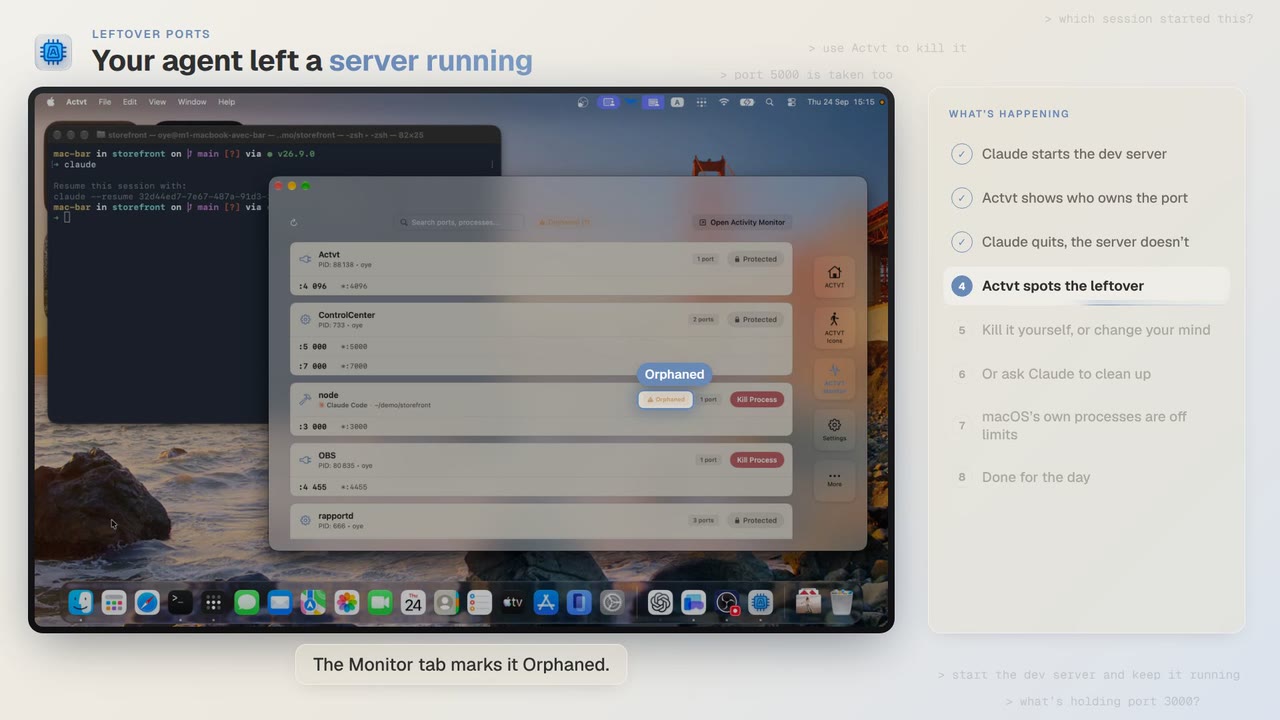
Leftover ports
Find and kill the dev server Claude Code or Codex left running
Claude Code starts a dev server and then quits, and port 3000 stays taken. ACTVT shows you the server whose session is gone and lets you free the port safely.
 0:48
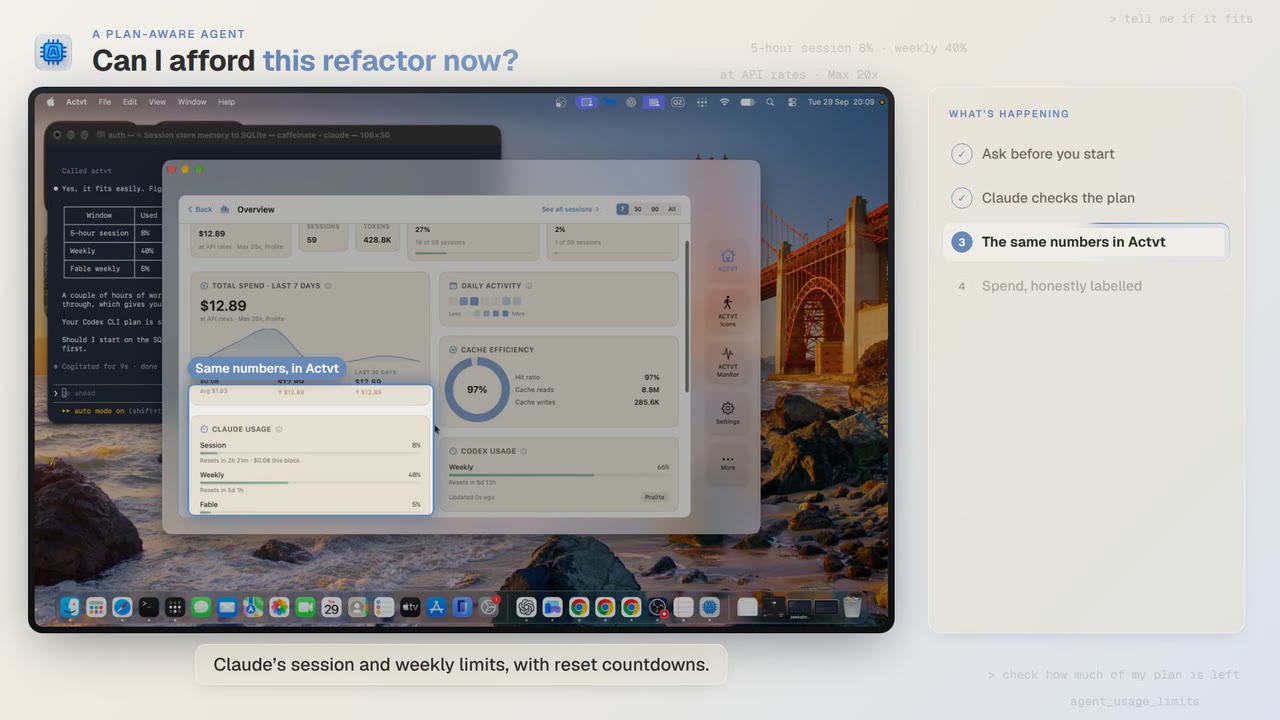
A plan-aware agent
Check your Claude and Codex plan limits before a long agent job
Before a two-hour job, Claude Code asks ACTVT how much of your plan is left. You can see the same limits in ACTVT, along with when each one resets.
Try it on your own agents
ACTVT is free to start, and reads the session files Claude Code, Codex CLI and Pi already write. Nothing to configure.